
Following up on the article Optical Tolerances – Part 1, Part 2 discusses the quantitative measure of image quality.
The modulation transfer function (MTF) is a quantitative measure of image quality. MTF describes the ability of a lens or system to transfer object contrast to the image. Consider a sine-wave chart in the form of positive transparency in which transmittance varies in one dimension. Assume that the transparency is viewed against a uniformly illuminated background. The maximum and minimum transmittances are Tmax and Tmin, respectively. A lens system under test forms a real image of the sine-wave chart, and the spatial frequency (u) of the image is measured in cycles per millimeter. Corresponding to the transmittances Tmax and Tmin are the image irradiances Imax and Imin. The contrast or modulation of the chart and image are defined, respectively, as
where Mc is the modulation of the chart and Mi is the modulation of the image. The modulation transfer function of the optical system at spatial frequency u is then defined to be
![]()
MTF curves can be either polychromatic or monochromatic. Polychromatic curves show the effect of any chromatic aberration that may be present. For a well-corrected achromatic system, polychromatic MTF can be computed by weighted averaging of monochromatic MTFs at a single image surface. MTF can also be measured by a variety of commercially available instruments.
The MTF curve for a perfect imaging lens is only limited by the laws of diffraction (diffraction-limited performance). For such a system, the theoretical MTF is calculated as follows:
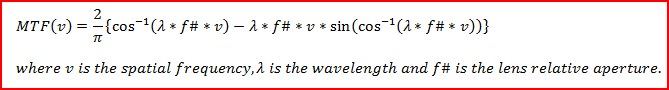
Calculate diffraction MTF using Sunex’s online MTF Wizard
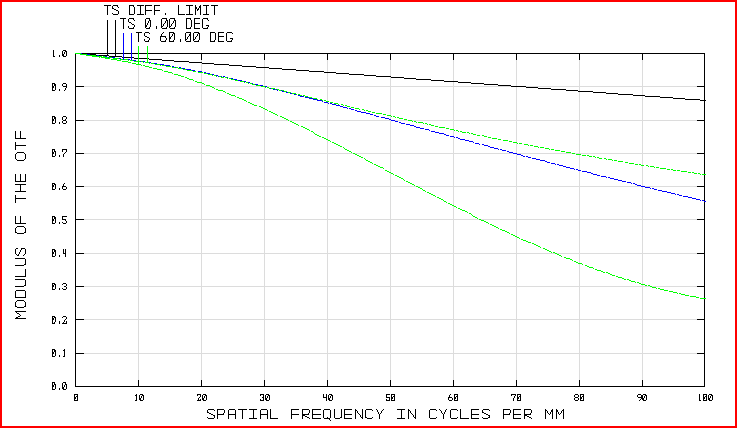
To achieve this level of performance, the optical design must be free of any aberrations, and the manufacturing process must maintain very tight tolerances. This requires a large number of lens elements with compensating aberrations. For most commercial applications, the lens MTF is far from the diffraction limit. The following diagram shows the design MTF of a practical lens vs. the diffraction limit (the black line is the diffraction limit, the blue line is the MTF on-axis, and green lines off-axis at 60 deg at tangential and sagittal target orientations):
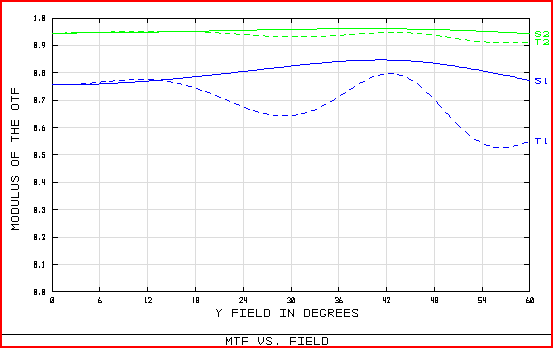
Since a lens MTF varies with the field angle, it is often more useful to exam the MTF at specific spatial frequencies vs. field positions. This plot shows the consistency of lens performance across the entire image plane. It is useful to select two (high and low) spatial frequencies. The low-frequency MTF value represents the overall contrast of the image, and the high-frequency MTF represents the capability of the lens to produce details. An example of such a plot is as follows (green lines are MTF values at 20 cycle/mm and the blue lines at 60 cycle/mm. The solid lines are for sagittal target orientation. Dash lines for tangential orientation):
Read part one of the article: Optical Tolerances – Part 1